In the first post in this series, we talked about the challenges of integrating the Internet of Things into the enterprise. In the next few blog posts, we are going to build a simple IoT application that illustrates all the major aspects of working with SnapLogic and hardware. In this post, we’re going to skip device details, but at a high level we’ll have:
- A sensor somewhere (on-premises, from an API, etc.) that produces data that includes a “color” payload;
- An LED on-premise, attached to our local network, conveniently hooked up to look like a REST endpoint;
- Two pipelines, one on-premise, one in the cloud.
Hardware Considerations
Some IoT hardware is designed to be cloud-native, and will generally have a publish/subscribe relationship with a cloud server (such as MQTT). This is very easy to work with from a security standpoint, since the output of these devices are accessible from anywhere.
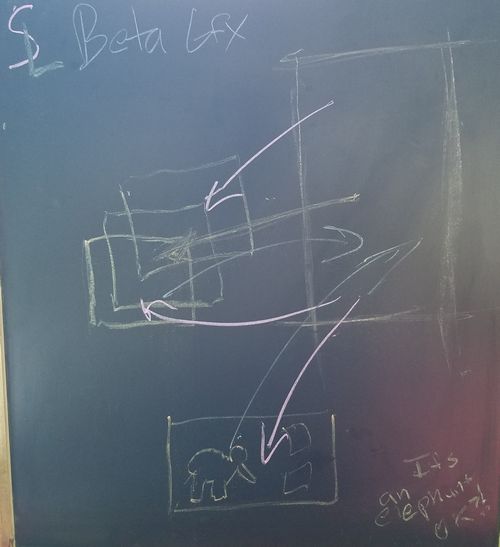
Other devices instead communicate on their local network. Assuming your local network isn’t internet accessible, this can create problems in talking to the device. Usefully, the SnapLogic Control Plane (depicted, in a manner of speaking, as the rightmost rectangle below) comes to our rescue here.

The SnapLogic Elastic Integration Platform is divided into two parts – the control plane and the data plane. We maintain the control plane, which runs as a multi-tenant cloud service. The data plane contains the actual execution engines. These can be in the cloud or on prem, in any mixture. Hold onto this thought, and we’ll come back to it.
The SnapLogic Architecture
One possible architecture, and the one we’ll use in this series, is to have a data flow pipeline in the cloud that always listens for events from our device. We could make this a REST API endpoint, but we are going to use MQTT for these examples. (Since MQTT needs to constantly ‘listen’, it needs to be in an always running pipeline, which we get by setting up an Ultra task. You can see this blog series for more information on this.)
So we build the following pipeline. The Record Replay Snap is optional, but serves as a helpful troubleshooting aid. Otherwise, we have a very straightforward pipeline – we received data from an MQTT broker, parse it into JSON format (actually an array of JSONs), and we put that array into a ForEach Snap.

In this particular case, our incoming JSON looks like this:
[{"deviceId":"machina_pi_0","x":"-0.034","y":"0.015","z":"-1.002","color":"#03024c"}]
In our application, we want to pass the received color data to the light that exists inside our firewall, and have it light up that color. Right now the application is trivial, but getting that color data inside your firewall generally isn’t.
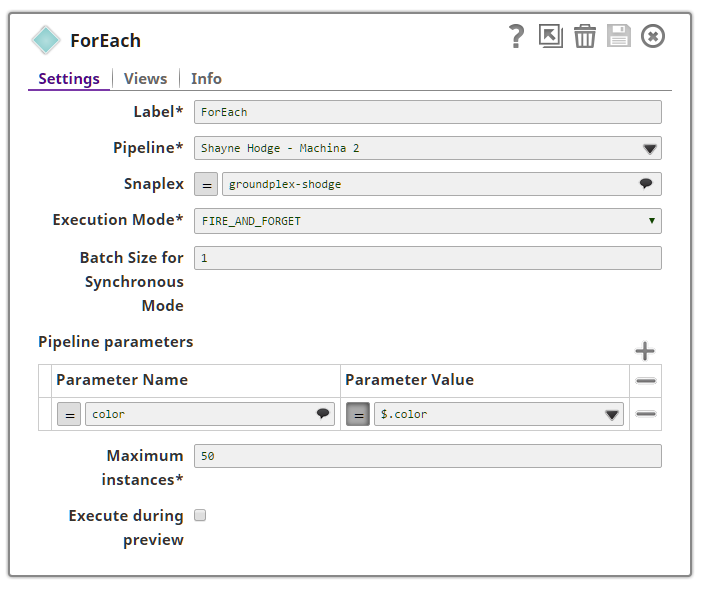
This is where the SnapLogic control plane (our Integration Cloud, where you design, manage and monitor pipelines) and the ForEach Snap come into play. Every time a new document (sensor reading) comes in, the ForEach Snap will execute another pipeline. This second pipeline does not have to be in the same Snaplex as the originating pipeline. The control plane can route it to any pipeline in your account, even those within your firewall. So we configure our ForEach thusly:

The ForEach executes a new pipeline, “Shayne Hodge – Machina 2”, for every sensor reading it receives from the MQTT broker. It passes as a parameter to that pipeline the color payload ($.color ) we wanted. And this second pipeline is in a Groundplex running behind our firewall that can talk to our LED:

Tune in to the next post in this series for details on a local triggered pipeline. In the meantime, you should always feel free to reach out to us to request a demo.


