In the last post we went into some detail about anomaly detectors, and showed how some simple models would work. Now we are going to build a pipeline to do streaming anomaly detection.
We are going to use a triggered pipeline for this task. A triggered pipeline is instantiated whenever a request comes in. The instantiation can take a couple of seconds, so it is not recommended for low latency or high-traffic situations. If we’re getting data more frequently than that, or want less latency, we should use an Ultra pipeline. An Ultra pipeline stays running, so the input-to-output latency is significantly less.
For the purpose of this post, we’re going to assume we have an Anomaly-Detector-as-a-Service Snap. In the next post, we’ll show how to create that Snap using Azure ML. Our pipeline will look like this:

Our first Snap serves as a REST endpoint; that is, it’s basically having the pipeline provide a web server. If you POST a message with a JSON payload to the provided URL, the output of that Snap will be the sent JSON as a document. (In fact, we’re using a Record Replay Snap here to cache input data, so once we send an input to the pipeline, we’ll have it stored to reuse as we develop without needing to keep POSTing new data.)
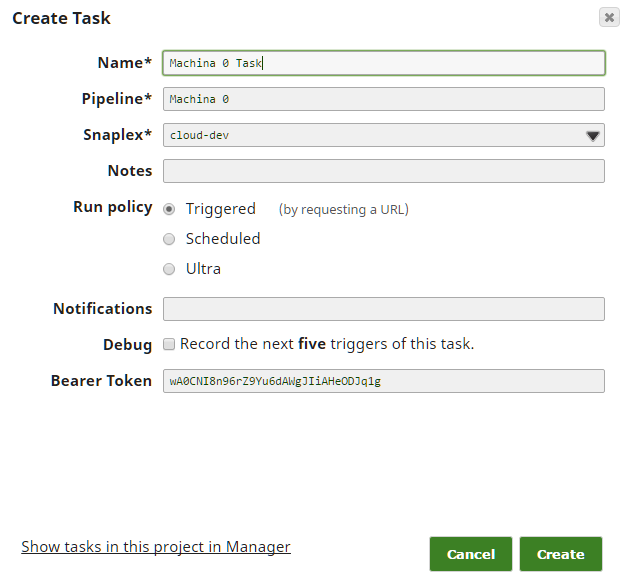
If you’re following along in SnapLogic, you’ll notice that the Record Replay Snap doesn’t have an input as is shown in the picture. To add it, click the Snap, click on “Views”, and then click the plus sign “+” next to input to add an input. Next, before we forget, let’s set up the Triggered Task so we can POST to this pipeline. Click the “Create task” button, outlined in green below.

Next, fill in the fields – in most cases, the defaults should work; just ensure you have selected the “Run policy” of “Triggered”.

Finally, we need to take a quick detour to Manager to get the URL and Authorization Token for this Task. Drill down on the side navigation pane to Projects -> <Your Project> -> Tasks. In the right hand task pane, click the dropdown arrow and then Details. You’ll be taken to the page with the URL and token you need, as well as a Task Status log. You’ll want to come back here if things seem not to be working right to see if there are failures in the execution of the pipeline.

Now you can take that URL and auth token and give it the application or device that you want to send you data. For this project, we’ve created a Python script that randomly generates data (in JSON format) and POSTs it to the pipeline. In general, it’s easiest to use “stubs” like this and switch to the real source when you know everything else is setup correctly.
We feed the incoming data from our REST endpoint into our black box anomaly detector. The detector returns a judgement on each point as either ‘good’ or ‘bad’. We have a Router Snap send good and bad points down different processing paths. If you followed the IoT Series, you’ll have seen where we built a pipeline that blinks an LED a different color depending on the payload POSTed to it. Here we’ve reused that light, transforming the ‘good’ into a ‘color: ‘green” payload and the bad into a ‘color:’red” payload, and send it back to the light.
We could just instead log anomalous points to a database, have it trigger a service such as PagerDuty, or post an announcement in a Slack channel. (Or we could do all of these, or pick different notification channels depending on date and time-of-day.) The main thing to note is that there’s two main components to this pipeline: (1) the ability to ingest data by acting as a POST endpoint and (2) the ability to pass that data to a REST API and process the output just as any other document in SnapLogic. The Snaplogic REST Snaps allows us to treat arbitrary web services as just another Snap in a pipeline.
In the final installment of this series, we’re going to take a look inside the black box of the AzureML request Snap, and see how we implement it.


